I'm an Erasmus Mundus Scholarship recipient in the field of Tribology of Surfaces and Interfaces. The masters program takes place in four different universities namely University of Leeds (UK), University of Ljubljana (Slovenia), University of Coimbra (Portugal) and Lulea Technical University (Sweden).
Wear Particle Analysis
21.09.2022
Table of Contents
Introduction:
Wear Particle analysis (WPA) is important to identify the wear mechanism in a system. For complex systems where it’s unusual and highly difficult to perform analysis under a microscope or to check for weight loss to determine the wear rate and wear mechanism. So, wear particle analysis is useful in such stages which can help in identifying the wear mechanism of a complex system. Wear can occur because of the presence of hard particles in the oil, hard particles from the wear of materials, hard particles entering into the system from the environment due to improper or faulty sealings, and particles from fuel combustion, etc. Usually wear will be higher at the beginning (running-in wear) and at the end (end-of-life wear) of component life and these are called activewear regions whereas in between these two there’s steady and low wear with very few random failures and this zone is called the benign wear. [1]
Need for WPA
Due to the fact that the particles to be analyzed are gathered by taking a sample of lubricating oil, wear particle analysis is correlated to oil analysis. Wear particle analysis gives immediate information regarding the condition of wear of the oil-wetted parts of a system, as opposed to lubricating oil analysis, which provides us only the condition of the oil. WPA can be qualitative or quantitative. In quantitative analysis the size and quantity of the wear particles are analyzed by use of techniques such as direct reading ferrography, particle count method, pore blockage method, wear method, inductive method, ultrasonic method, etc of which direct reading ferrography is the most popular one. In qualitative analysis, the morphology and chemical composition of the wear particles are analyzed by using analytical ferrography, filtergraphy, and spectroscopy techniques. Usually, if the size of the wear particle is increasing along with its concentration then it leads to a catastrophic failure, but for some cases such as corrosive wear, this need not be true as in such cases the concentration of wear particles is very high whereas the size is small and it leads to catastrophic failure. The general process which is followed for the wear debris analysis procedure is oil sampling, wear particle analysis, and interpretation of results. [2]
Qualitative Analysis
Analytical ferrography
Analytical ferrography is one of the most widely used techniques for wear particle analysis. If the oil containing the wear particles is viscous then in order for the oil to flow freely and to separate the wear particles from the oil it has to be diluted with some agents. This diluted oil sample is now allowed to flow over a glass slide called ferrogram. A magnetic cylinder with the ferrogram on it draws ferrous particles from the oil. Nonferrous particles are spread out over the length of the slide, while the biggest ferrous particles are typically deposited at the entrance point as shown in fig-1. To get rid of any last bits of lubrication, the wear particles are cleansed. The composition, concentration, morphology, surface finish, and size of the ferrous and non-ferrous wear particles are then examined under a microscope. By identifying the underlying cause, this evaluation aids in understanding abnormal wear conditions. EDX is an elemental composition analysis often coupled with a scanning electron microscope to get the composition of these wear particles. [3, 4]

Fig-1 Analytical ferrography [5]
Filtergraphy
The microscopic examination of contaminants and wear debris obtained from a filter which has wear particles on it is known as filtergram analysis. The membrane consisting of wear particles is heated to 90 °C for 10 minutes to make it transparent and ready for microscopic wear debris analysis and some solvent is used to eliminate presence of any residual oil on these particles. Filtergraphy is applicable for all particles (both ferrous and non-ferrous) unlike ferrography and it is much more effective in collecting wear particles.
Quantitative analysis
Direct reading ferrography
The quantity of ferromagnetic wear debris in an oil sample is determined using direct reading ferrography. Wear particles are detected by the ferrograph at two locations. The first one is at the entrance (designated as DL), while the second one is around 5 mm downstream (designated as DS). By calculating the quantity of light dimmed at the two deposition sites, it detects the presence of particles as depicted in fig-2. The results obtained are expressed using the following terms namely; DL for particles bigger than 5 µm, and DS for particles smaller than 5 µm. This technique provides immediate information regarding total wear particle concentration (WPC). WPC is calculated as the sum of DL and DS divided by the sample size (volume) which is typically 1 mL, thus the formula for WPC is WPC = DL + DS. In general use, DL is approximately equal to DS but when there is damage and subsequent failure development, DL rises faster than DS. The warning and critical limits are calculated by the formula, warning limit is the sum of the average of WPC and standard deviation whereas the critical limit is the sum of the average of WPC and twice the standard deviation. For any system after passing through the running-in phase where the wear is usually high, if there’s a huge rise in WPC this indicates that there’s failure initiation and if this WPC crosses the critical limit then we stop the system performing ferrography and then qualitative analysis. [6] There are several other quantitative techniques that can also be used such as the ultrasonic method, particle count method, pore blockage method, etc.
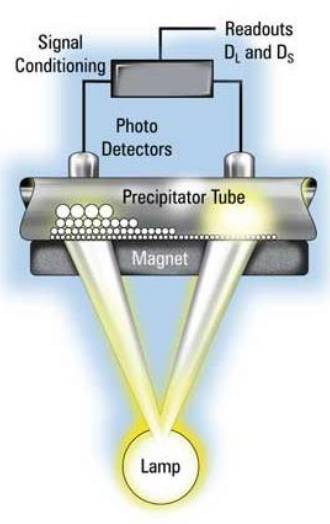
Fig-2 Direct reading ferrography [7]
References
- Wear debris analysis, M.J. NEALE, Tribology Handbook (Second Edition), Butterworth-Heinemann, 1995, Pages D14.1-D14.9, ISBN 9780750611985, https://doi.org/10.1016/B978-075061198-5/50105-3.
- Laghari, Mohammad & Memon, Qurban & Khuwaja, Gulzar. (2004). Knowledge Based Wear Particle Analysis. International Journal of Information Technology.
- Macián, Vicente, Raúl Payri, Bernardo Tormos and L. Montoro. “Applying analytical ferrography as a technique to detect failures in Diesel engine fuel injection systems.” Wear 260 (2006): 562-566.
- “Analytical ferrography.” Azo materials, 29 April 2013, https://www.azom.com/article.aspx?ArticleID=8570
- Newcomb, Timothy, and Mark Sparrow. “Analytical Ferrography Applied to Driveline Fluid Analysis.” SAE International Journal of Fuels and Lubricants 1, no. 1 (2009): 1480–90. http://www.jstor.org/stable/26272108.
- Chapter 9 - Ferrography, Knud G. Bøving, NDE Handbook, Butterworth-Heinemann, 1989, Pages 88-102, ISBN 9780408043922, https://doi.org/10.1016/B978-0-408-04392-2.50015-1.
- “Wear analysis.” Machinery lubrication, https://www.machinerylubrication.com/Read/382/wear-analysis
Leave a Reply
You must be logged in to post a comment.
Very nice article for WDM
Thank you.