








Power Spectral Density of Rough Surfaces
Power Spectral Density of Rough Surfaces describes power spectral density rough surfaces as a practical tribology topic: how surfaces interact, how friction, wear, lubrication, material response, and operating environment influence performance, and what engineers should check when applying the concept in real machines or laboratory tests.
- Core idea: power spectral density rough surfaces should be interpreted as a system-level contact problem, not as an isolated material property.
- Engineering relevance: load, speed, temperature, surface roughness, chemistry, and lubrication regime can change the observed behavior.
- Good practice: combine measurements with surface inspection and clear reporting of test conditions.
- Failure prevention: use the topic to identify risks early, compare alternatives, and improve reliability.
Table of Contents
What is Power Spectral Density of Rough Surfaces?
Power Spectral Density of Rough Surfaces is part of the wider study of friction, wear, contact mechanics, materials, and lubrication. In practical use, the term is most useful when it is connected to a defined contact pair, surface condition, operating load, motion type, and environment.
For engineers, power spectral density rough surfaces is not only a definition. It is a way to ask which mechanisms control performance at an interface: elastic or plastic deformation, adhesion, abrasion, fatigue, chemical film formation, lubricant starvation, debris generation, or changes in surface topography.
Why Power Spectral Density of Rough Surfaces matters in tribology
Power Spectral Density of Rough Surfaces matters because small changes at the surface can produce large changes in efficiency, temperature, noise, lifetime, and failure risk. A contact that appears acceptable under one load, speed, or lubricant can behave very differently when the regime shifts from full-film lubrication to mixed or boundary lubrication.
| Question | Why it matters |
|---|---|
| What materials and surfaces are in contact? | Hardness, roughness, coating, oxide layers, and chemistry influence friction and wear. |
| What motion occurs? | Sliding, rolling, reciprocating, impact, and vibration activate different damage mechanisms. |
| What lubrication regime is present? | Boundary, mixed, hydrodynamic, and elastohydrodynamic regimes produce different surface separation and film behavior. |
| What environment is involved? | Temperature, humidity, vacuum, contamination, and reactive species can strongly change tribochemical response. |
Engineering factors to consider
- Contact stress and geometry: estimate nominal and local contact pressure, including asperity-scale effects where relevant.
- Surface topography: measure roughness, waviness, texture direction, and surface defects before and after testing.
- Lubricant selection: consider viscosity, additives, supply method, contamination, and compatibility with materials.
- Thermal conditions: frictional heating can change viscosity, hardness, oxidation rate, and tribofilm formation.
- Running-in: early surface adaptation may control the later steady-state response.
- Debris control: wear particles can become a third body, accelerating abrasion or changing friction.
Measurement and interpretation
When evaluating power spectral density rough surfaces, report the test configuration clearly: specimen geometry, material grade, surface roughness, lubricant, load, speed, temperature, duration, environment, and repeat count. Tribology results are often system-dependent, so a coefficient of friction, wear scar, or lifetime result should not be treated as a universal property without context.
Useful measurements include friction trace, wear volume or wear rate, surface profilometry, optical or electron microscopy, hardness, lubricant condition, and chemical surface analysis where tribofilms or oxidation are expected.
Related webinar: Surface-Topography Challenge
For a practical discussion of why a single roughness number is often insufficient, see TriboNet’s webinar Surface-Topography Challenge, presented by Professor Tevis Jacobs and Dr. Arushi Pradhan. The webinar connects directly to PSD analysis because it emphasizes scale-dependent surface measurement, instrument resolution, calibration, and the need to describe the whole surface spectrum rather than relying only on Ra or RMS roughness.
The accompanying recording is available here: Surface-Topography Challenge webinar recording.
Detailed background and source material
Roughness is known to be an important factor in friction, wear and related performance of the machine parts. It was shown recently that Power Spectrum Density (PSD) can be used as a metric to describe the surface from tribological point of view. Besides the field of tribology, roughness determines surface properties, such as hydrophulicity, adhesion, fatigue resistance, etc. Some of the analytical models of contact mechanics predict contact area, stiffness and other important parameters based on the PSD. Therefore, knowledge of PSD of a surface can bring valuable information about its (tribological) properties.
Power spectral density reveals presence and contribution of different spatial frequencies (wavelengths, wavevectors) in the surface. For example, if the surface roughness is composed of two sine waves of different wavelengths, its PSD will have only two peaks (see the figure below). These peaks indicate presence of two wavelengths in the surface.

Power Spectral Density of a surface composed of two sine waves of different wavelength
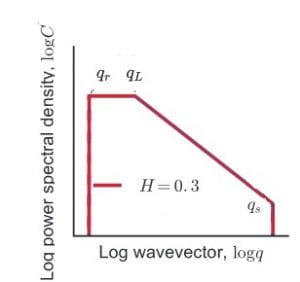
Power spectral density of a randomly rough surfaces was shown to frequently look like in the figure below:


Power spectral density of randomly rough surface
In this case, the PSD reveals a self-affine surface, which is not always the case (if not self-affine, it may look curved and not straight line).
There are various definitions of the power spectral density, which differ typically with a constant. Here we follow [1] and define the PSD as follows:
 ,

where  is the 2 dimensional PSD, A is the area of the surface,
 are wavevectors in x and y directions. Fourier transform of the surface is given as follows:
 .
Equivalent definition of the PSD is used by B. Persson [2]:
 ,

where the <..> denotes average of the ensemble. These definitions are equivalent due to Wiener-Khintchine theorem [2].
The definition of the power spectral density in terms of Fourier transform seems to be more convenient, since it also shows a direct way of calculating it for a given surface.
FAQs
What is Power Spectral Density of Rough Surfaces in simple terms?
Power Spectral Density of Rough Surfaces is a tribology topic used to understand how contacting surfaces behave under load, motion, lubrication, and environmental conditions.

Why is power spectral density rough surfaces important for engineers?
It helps engineers diagnose friction and wear problems, choose materials or lubricants, design tests, and prevent surface-related failures.
How should power spectral density rough surfaces be tested?
Testing should reproduce the relevant contact geometry, motion, load, speed, temperature, surface roughness, lubricant, and environment as closely as practical.
What should be reported with power spectral density rough surfaces results?
Report materials, roughness, lubricant, load, speed, temperature, duration, environment, friction history, wear measurement method, and post-test surface observations.
See also
- Friction
- Wear
- Lubrication
- Rolling Contact Fatigue
- Surface Fatigue
- Tribochemistry
- Surface-Topography Challenge webinar
References and further reading
- Bhushan, B. Introduction to Tribology. Wiley.
- Stachowiak, G. W., and Batchelor, A. W. Engineering Tribology. Butterworth-Heinemann.
- Hamrock, B. J., Schmid, S. R., and Jacobson, B. O. Fundamentals of Fluid Film Lubrication. CRC Press.
- NIST resources for measurement, materials, and surface characterization.
- Surface-Topography Challenge, TriboNet webinar with Professor Tevis Jacobs and Dr. Arushi Pradhan.
Last updated: May 2026. Reviewed topic: Power Spectral Density of Rough Surfaces, tribological performance, measurement, and failure prevention.
References
- [1] Quantitative characterization of surface topography using spectral analysis, Tevis Jacobs, Till Junge and Lars Pastewka.
- [2] On the nature of surface roughness with application to contact mechanics, sealing, rubber friction and adhesion, Bo Persson, O Albohr, U Tartaglino, A I Volokitin and E Tosatti
This looks like it uses uncredited figures from Jacobs, Junge, and Pastewka published in 2016.