







Essential Friction Coefficients in Air vs Vacuum: 12 Materials Compared
Friction coefficient tables for solid lubricants, metals, plastics and anti-friction materials
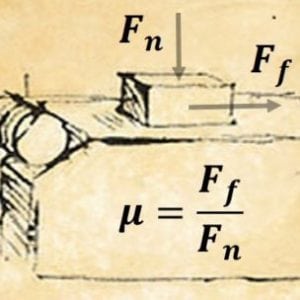
Friction Coefficients in Air vs Vacuum are critical for engineers, designers, and scientists who need to understand how materials interact under different environmental conditions. Whether you are working with metals, plastics, wood, or lubricated surfaces, knowing the friction coefficients in air compared to vacuum can help predict wear, efficiency, and performance [1,2,3]. See the definition of friction coefficient.
Steel friction coefficient table
| Material Combination | Friction coefficient in air | Friction coefficient in vacuum |
| Fe-Fe | 0.3 | 1.9 |
| Fe-Mg | 1 | 0.6 |
| Fe-Cd | 1.5 | 0.4 |
| Fe-Pb | 0.9 | 0.4 |
| Stainless Steel -Stainless Steel | 0.5 | 2.9 |
| Stainless Steel – Cu | – | 0.3 |
| Stainless Steel-Al | 0.4 | 0.3 |
| Stainless Steel-Mo | – | 0.8 |
| Stainless Steel-Ni | – | 0.8 |
| Stainless Steel-Teflon | – | 0.2 |
| Stainless Steel-Si | – | 0.2 |
| Stainless Steel-Ge | – | 0.2 |
| Stainless Steel-Glass | – | 0.5 |
| Chromium Steel – Chromium Steel | 0.5 | 0.5 |
| Cu-Cu | 0.5-1.0 | 4.8-21.0 |
| Cu-Ni | 0.6 | 1.5-2.0 |
| Al-Al | 0.8 | 1.6-2.2 |
| Al-Ni | – | 2.4 |
| Al-Cu | – | 1.5 |
| Al-Ag | – | 2.2 |
| Brass-Brass | 0.4 | 0.7 |
| Ni-Ni | – | 4.9 |
| Ag-Ag | – | 3.9 |
| Cr-Cr | 0.6 | 3 |
| Au-Au | 0.6 | 4.5 |
| Zn-Zn | 1 | 3 |
| Zr-Zr | – | 1.5 |
| Chromium Steel – MoS2 (vacuum deposition) | – | 0.06 |
| Chromium Steel – MoS2 (friction deposition) | – | 0.06 |
| Cu-MoS2 | 0.2 | 0.07 |
| Brass-Steel | 0.35 | – |
| Tire – Asphalt | 0.72 | – |
| Tire – Grass | 0.35 | – |
| Diamond – Diamond | 0.1 | – |
| Glass – Glass | 0.9-1.0 | – |
| Graphite – Steel | 0.1 | – |
| Graphite – Graphite | 0.1 | 0.5-0.8 |
| Ice – Ice | 0.02-0.09 | – |
| Ice – Steel | 0.03 | – |
| Wood – Wood | >0.2 | – |
| Polytetrafluoroethylene – Polytetrafluoroethylene | 0.04 | – |
Air vs Vacuum Friction Coefficients – Metals & Solid Lubricants
| Materials | Static friction coefficient | |
|---|---|---|
| Steel | Aluminium Bros | 0.45 |
| Steel | Brass | 0.35 |
| Steel(Mild) | Brass | 0.51 |
| Steel | Cast Iron | 0.4 |
| Steel | Copper Lead Alloy | 0.22 |
| Steel (Hard) | Graphite | 0.21 |
| Steel | Graphite | 0.1 |
| Steel (Mild) | Lead | 0.95 |
| Steel | Phos Bros | 0.35 |
| Steel(Hard) | Polythened | 0.2 |
| Steel(Hard) | Polystyrene | 0.3-0.35 |
| Steel (Mild) | Steel (Mild) | 0.74 |
| Steel(Hard) | Steel (Hard) | 0.78 |
| Steel | Zinc (Plated on steel) | 0.5 |
| Steel | Tungsten Carbide | 0.4 – 0.6 |
| Steel | Teflon | 0.04 |
| Steel | Polythene | 0.2 |
| Steel | Polystyrene | 0.3-0.35 |
| Steel | Plexiglas | 0.4 – 0.5 |
| Steel | Hard Carbon | 0.14 |
| Steel | Graphite | 0.1 |
| Steel | Copper-Lead Alloy | 0.22 |
| Steel (Mild) | Copper | 0.53 |
| Steel (Mild) | Aluminum | 0.61 |
Wood, Leather & Stone: Friction Coefficients in Air vs Vacuum
| Material Pair | Static COF | Dynamic COF |
|---|---|---|
| Hardwood on hardwood | — | 0.129 |
| Oak on oak, parallel to the grain | 0.62 | 0.48 |
| Oak on oak, perpendicular to the grain | 0.54 | 0.32 |
| Cast iron on oak | — | 0.49 |
| Brick on wood | 0.6 | — |
| Clean wood on metals | 0.2–0.6 | — |
| Leather on iron | — | 0.25 |
| Leather on oak, parallel to the grain | 0.61 | 0.52 |
| Leather on cast iron | — | 0.56 |
| Leather on metal | 0.6 | — |
Comparative Tables: How Air vs Vacuum Affects Friction Values
| Ceramic | Counterface | μ |
|---|---|---|
| Al2O3 | Al2O3 | 0.33–0.50 |
| Al2O3 | Al2O3 | 0.20–0.9 |
| α-Al2O3 | α-Al2O3 | 0.38–0.42 |
| Al2O3 | Al2O3–SiC composite | 0.53 |
| Al2O3–SiC composite | Al2O3–SiC composite | 0.64–0.84 |
| B4C | B4C | 0.53 |
| SiC | SiC | 0.52 |
| SiC | Si3N4 | 0.53–0.71 |
| WC | WC | 0.34 |
| Si3N4 | Si3N4 | 0.42–0.82 |
Ice friction coefficient
Depending on pressure, temperature, and the conditions of formation, ice can take on any of at least eight allotropic forms, the largest number for any known substance. These changes impact the ice friction coefficient behavior, as shown in the figure below.
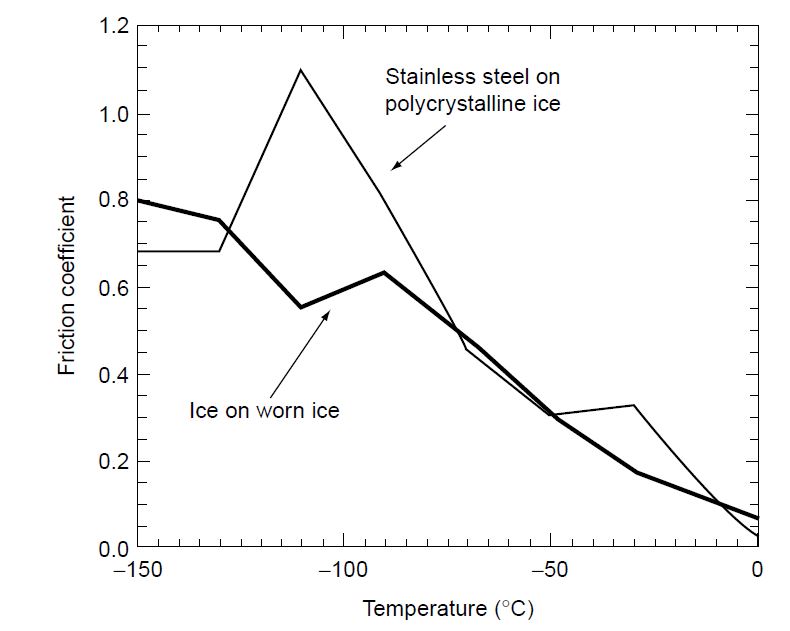
Figure 1. Friction coefficient for stainless steel and ice on polycrystalline ice as a function of temperature, [3].
| Material | μs (0°C) | μs (-5°C) | μs (-10°C) |
|---|---|---|---|
| Ski lacquer (pigmented nitrocellulose plasticized with phthalate) | 0.05 | 0.11 | 0.43 |
| Paraffi n wax | 0.04 | 0.27 | 0.37 |
| Norwegian wax (sulfur-free, bituminous wax) | 0.045 | 0.1 | 0.2 |
| Swiss wax (highly refi ned, bituminous, hydrocarbon wax with 1.5% Al powder) | 0.05 | 0.1 | 0.2 |
| Polytetrafluoroethylene (PTFE) | 0.04 | 0.05 | 0.55 |
Friction coefficient table for materials in fretting regime
In fretting, friction coefficients are different for the same pairs of materials due to changes in friction mechanisms. These tables include some data for commonly used materials.
| Ball Material | Flat Material | μinitial | μsteady-state |
|---|---|---|---|
| Cu | Cu | 1.2 | 0.6 |
| Cu | Glass | 1.2 | 0.65 |
| Fe | Fe | 0.7 | 0.65 |
| Fe | Glass | 0.8 | 0.85 |
| Steel | Steel | 0.6 | 0.55 |
| Steel | Glass | 1.3 | 0.62 |
| CuO | CuO | 0.7 | 0.65 |
| Cu2O | Cu2O | 0.65 | 0.62 |
| Fe2O3 | Fe2O3 | 0.62 | 0.6 |
| Fe3O4 | Fe3O4 | 0.3 | – |
Friction coefficient table in the fretting regime as a function of humidity
| Metal | μ steady-state | ||||||
|---|---|---|---|---|---|---|---|
| 0–2% RH | 10–12% RH | 49–50% RH | |||||
| Fe | 0.45 | 0.4 | 0.25 | ||||
| Ni | 0.42 | — | 0.19 | ||||
| Ti | 0.35 | 0.4 | 0.28 | ||||
| Cr | 0.25 | — | 0.22 |
Conclusion
In this article, we provide comprehensive tables of friction coefficients in air vs vacuum for a variety of materials, along with comparisons that make it easy to select the right material for your application. By studying these values, you can make informed decisions that improve durability and reduce energy loss
0 Comment