







Surface Roughness Interpretation for Tribology: Ra, Rq, Rz and Contact Performance
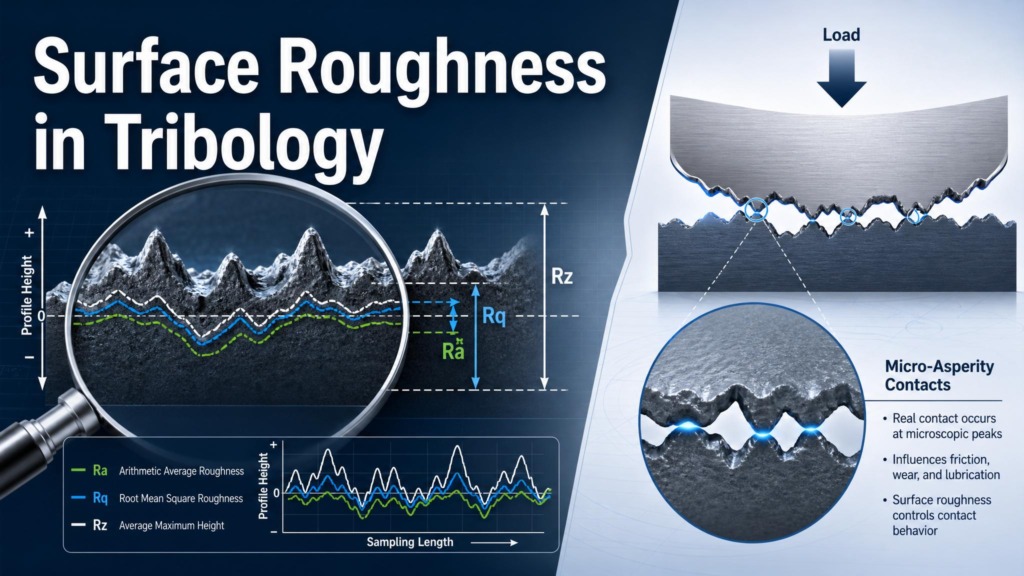
Surface roughness interpretation for tribology is more than reading Ra from a datasheet. Two surfaces can have the same Ra and behave very differently in friction, lubrication, sealing, running-in and wear. The contact does not “see” one roughness number; it sees asperity heights, valleys, slopes, texture direction, material, coating, lubricant and load.
This guide explains how to interpret common roughness parameters such as Ra, Rq and Rz in practical tribology work, and how to connect surface measurement to contact performance. For a deeper measurement perspective, TriboNet’s Surface-Topography Challenge webinar recording shows why identical surfaces can produce different roughness results when laboratories use different instruments, resolutions and analysis settings.
Ra is useful for quick quality control as a KPI, but it is not enough to predict tribological performance. For friction, wear and lubrication, engineers should also consider Rq, Rz, skewness, kurtosis, texture direction, filtering, measurement method, surface preparation and the real contact condition. Always report roughness with the measurement standard, cutoff/filter, direction and instrument type.
- Ra is an average deviation; it hides peaks, valleys and texture shape.
- Rq is more sensitive to large peaks and valleys than Ra.
- Rz gives peak-to-valley information but depends strongly on method and sampling.
- Skewness and kurtosis help describe plateau, spiky or valley-rich surfaces.
- Tribology interpretation needs roughness plus load, lubricant, material and wear mechanism.
Table of Contents
Surface roughness interpretation rules
Good surface roughness interpretation starts by treating surface roughness as functional data, not just a finish number. In tribology, surface roughness should be checked against load, lubrication regime, sliding direction, coating thickness, film thickness and the expected wear mechanism. Surface roughness measurements also need scale information: instrument resolution, filtering, cutoff, map size and calibration can change the reported value.

Use surface roughness values as a starting point, then confirm the full surface topography when friction, wear, sealing or lubrication performance matters.
Why Ra alone is not enough
Ra, the arithmetic average roughness, is widely used because it is simple and familiar. It is also easy to misuse. Ra compresses a surface profile into one average number. It does not reveal whether the surface has sharp peaks, deep lubricant-retaining valleys, plateau-like features or directional machining marks.
In tribology, those hidden details matter. Sharp peaks may cause high running-in wear, which then changes the wear rate measured after the test. Valleys may help lubricant retention. Directional grinding marks may reduce or increase coefficient of friction depending on sliding direction. A plateau-honed surface and a randomly polished surface can have similar Ra but different behavior.
Recommended webinar recording: TriboNet’s Surface-Topography Challenge is the most relevant companion resource for this topic. The recording discusses the World Surface Topography Challenge, including why surface roughness measurements vary between AFM, optical profilometry, stylus profilometry and confocal methods.

Ra, Rq and Rz: what each parameter tells you
| Parameter | Meaning | Useful for | Tribology caution |
|---|---|---|---|
| Ra | Arithmetic average of absolute profile deviations | General quality control and specification | Does not show peak sharpness, valleys or texture distribution |
| Rq | Root-mean-square roughness | Surfaces where larger deviations matter | More sensitive to outliers than Ra |
| Rz | Peak-to-valley height over sampling lengths, depending on standard | Checking extreme height features | Method-dependent; compare only when measurement rules match |
| Rsk | Skewness of height distribution | Plateau vs peak-dominated vs valley-rich surfaces | Needs stable measurement and correct filtering |
| Rku | Kurtosis of height distribution | Detecting spiky or unusually distributed surfaces | Can be sensitive to noise and isolated defects |
| Sa/Sq/Sz | 3D areal versions of common roughness concepts | Complex surfaces, wear scars and textures | Area size, leveling and filtering choices are critical |
For engineering decisions, the goal is not to report more parameters for decoration. The goal is to choose parameters that describe the features controlling the contact.
How surface roughness affects contact performance
Surface roughness influences tribology through several mechanisms:

- Real contact area: load is initially carried by asperity peaks, not by the full apparent area.
- Running-in: high asperities may deform, fracture or wear away during early operation.
- Lubricant film formation: roughness competes with lubricant film thickness in boundary and mixed lubrication.
- Debris generation: sharp or brittle asperities can become wear particles.
- Transfer films: surface texture can help or disrupt stable transfer-layer formation.
- Sealing: valleys may provide leakage paths, while too-smooth surfaces may not retain lubricant.
- Coating performance: substrate roughness can print through thin coatings and affect stress concentration.
A practical rule is to compare roughness with the expected film thickness, coating thickness and wear depth. A roughness feature that is small for a heavily loaded dry contact may be large for a thin coating or elastohydrodynamic lubricant film. For related test-selection context, see TriboNet’s guide to wear testing methods.
Roughness direction and texture matter
Tribological surfaces are often anisotropic. Grinding, turning, honing, polishing, additive manufacturing and wear all create directional features. Sliding parallel to grooves can behave differently from sliding across them. Seal leakage, lubricant retention and abrasive particle trapping can also depend on texture direction.
When reporting roughness, state the measurement direction relative to manufacturing marks and expected sliding direction. For 3D areal measurements, include map size and orientation when relevant.
Filtering and cutoff: the hidden reporting problem
Roughness values depend strongly on filtering. A profile may contain form, waviness and roughness at the same time. If the cutoff length or filter choice changes, the reported Ra, Rq or Rz can change even on the same surface.

Reports should state:
- instrument type: stylus profilometer, optical profilometer, confocal, interferometer, AFM, SEM reconstruction or other method;
- standard used, if applicable, such as ISO 21920 surface texture terminology;
- evaluation length or area size;
- cutoff/filter and leveling method;
- measurement direction and number of locations;
- whether defects, pores, scratches or wear scars were included or excluded.
Without these details, roughness numbers from different labs can be difficult to compare.
Surface roughness reporting checklist for tribology
Before linking roughness to friction or wear, record:
- surface preparation method and final process step;
- instrument and measurement mode;
- Ra, Rq and Rz or areal equivalents where useful;
- skewness/kurtosis or bearing-area parameters for functional surfaces;
- cutoff, filter, evaluation length/area and standard;
- measurement direction relative to sliding or texture;
- number of locations and scatter;
- surface images or height maps for context;
- contact load, lubricant, material pair and test environment;
- post-test roughness or wear-scar topography when interpreting wear.
How to interpret roughness in common tribology cases
Boundary lubrication
In boundary lubrication, asperity contact is significant. Roughness affects additive film formation, contact pressure, running-in and wear. Ra alone is weak; peak shape, valleys and surface chemistry are often more important.
Mixed lubrication
In mixed lubrication, both fluid film and asperity contact matter. Compare composite surface roughness with estimated film thickness. The lambda ratio concept can help, but it still needs realistic surface and lubricant data.
Dry sliding and coatings
For dry sliding, rough peaks may create high initial wear or help form a transfer film depending on materials. For thin coatings, substrate and coating roughness must be interpreted relative to coating thickness and load support.
Seals and textured surfaces
For seals, an ultra-smooth surface is not always best. Some texture may retain lubricant, while directional grooves can create leakage paths. Functional parameters and texture orientation are often more useful than Ra alone.
FAQ
What is the difference between Ra and Rq?
Ra is the arithmetic average roughness. Rq is the root-mean-square roughness and is more sensitive to large peaks and valleys.
Is lower Ra always better for friction?
No. Very smooth surfaces can reduce abrasive asperity contact, but they may also reduce lubricant retention or transfer-film stability. The best roughness depends on the contact and lubrication regime.
Why can two surfaces with the same Ra perform differently?
They may have different peak shapes, valley depth, skewness, texture direction, material, coating, waviness or surface chemistry. Ra hides these differences.
Should tribology reports use 2D or 3D roughness?
Both can be useful. 2D profiles are common and standardized; 3D areal measurements are often better for complex textures, wear scars and non-directional surfaces.
What roughness parameters matter for lubrication?
Ra and Rq are useful starting points, but valleys, skewness, bearing-area parameters, texture direction and film thickness are often more relevant to lubricant retention and mixed lubrication.
How should roughness be reported?
Report the parameter values with instrument type, standard, cutoff/filter, evaluation length or area, measurement direction, number of locations and surface preparation method.
Takeaway
Surface roughness is not a single number. In tribology, roughness should be interpreted as part of the contact system: geometry, material, lubricant, load, speed, temperature and wear mechanism.
For further learning, start with TriboNet’s Surface-Topography Challenge webinar recording. It is directly relevant to roughness interpretation because it shows how instrument choice, resolution correction, calibration and scale-dependent analysis affect the roughness numbers engineers use for tribological decisions.
Related TriboNet guides: How to Measure Wear Rate, How to Report Coefficient of Friction Correctly, and Wear Testing Methods Compared.
0 Comment